


infographics
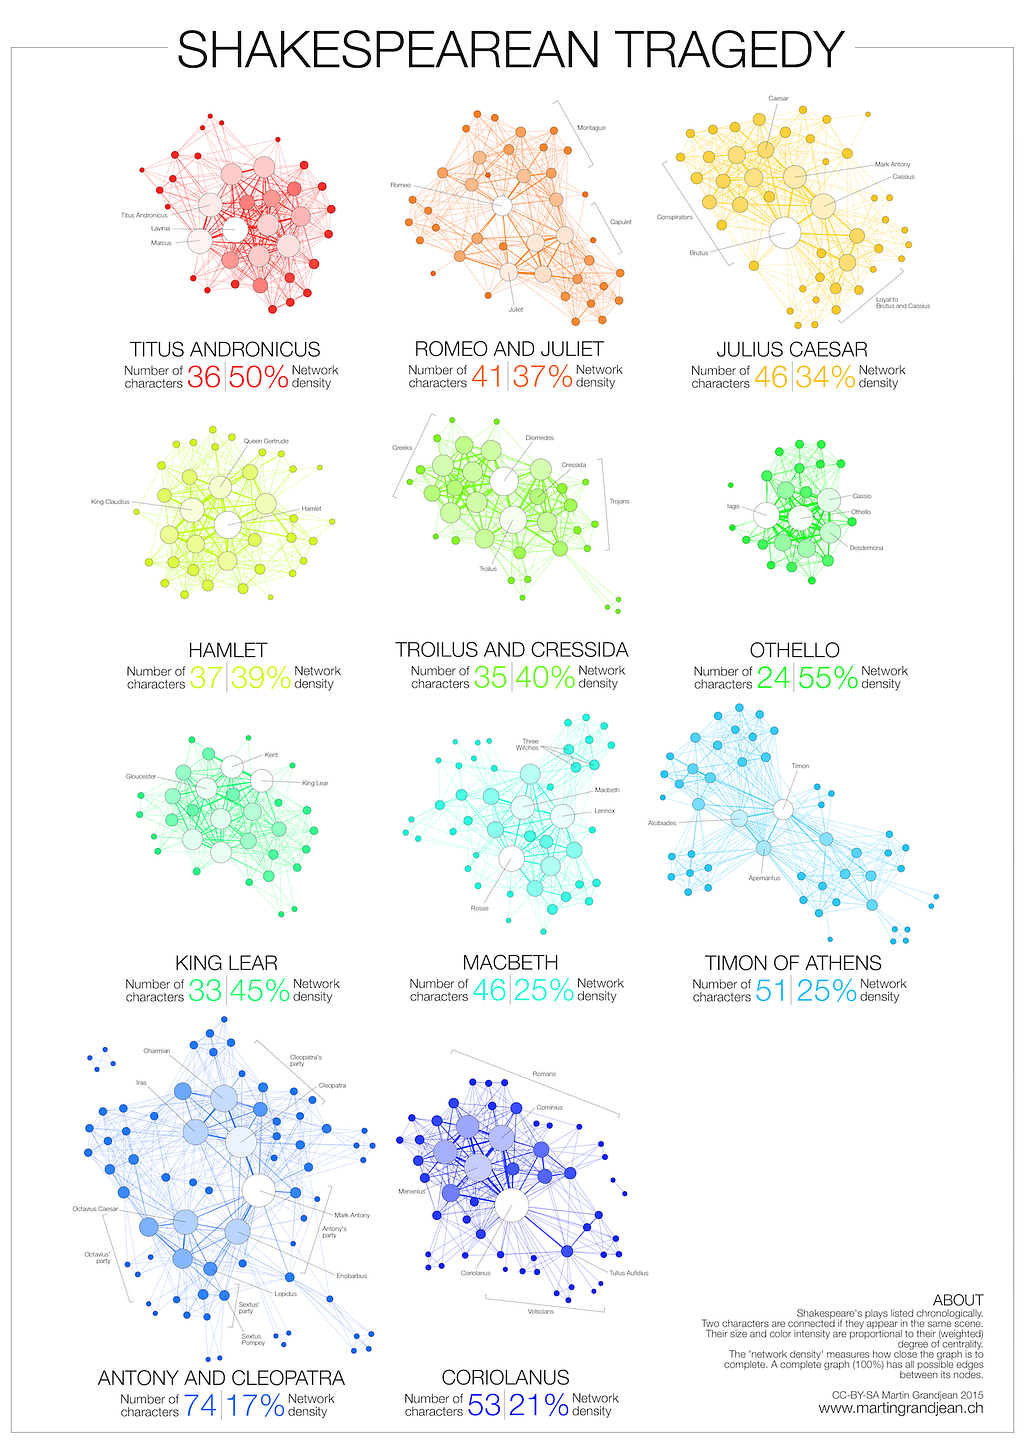
INFOGRAPHIC: Analyzing Shakespeare’s Characters
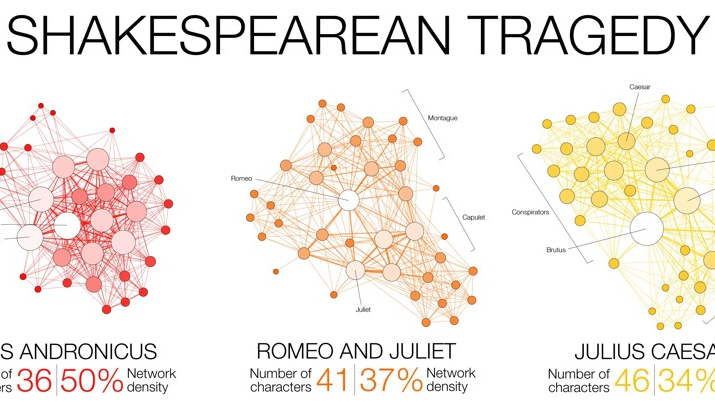
Are you a Shakespeare fan? This infographic lets you investigate his tragedies by looking at his character interactions. Are they closely connected or isolated? Do all his plays have similar structure and density? Find out below. The infographic was created by data research analyst and designer Martin Grandjean.
Open the image in a new tab to get a closer look.


